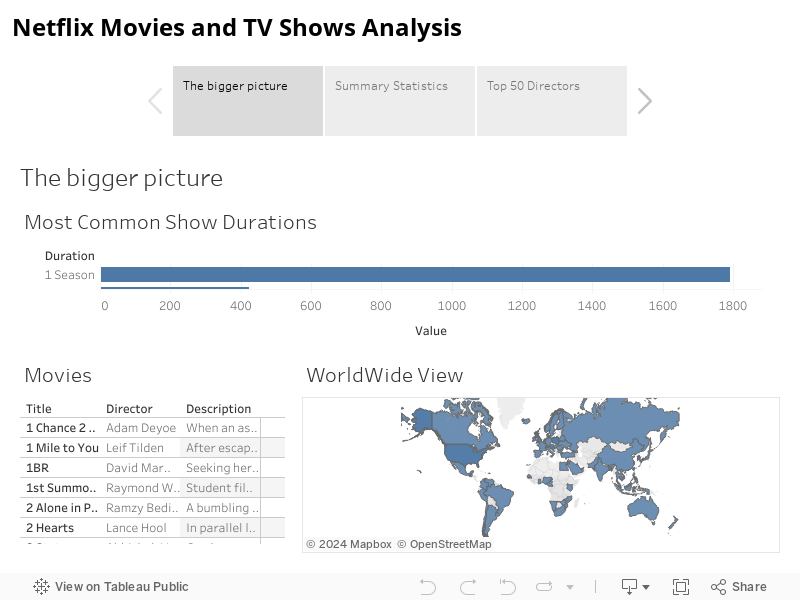
Exploring the 2021 Kaggle Netflix Movies and TV Shows dataset in order to explore how the number of Movies and TV Shows on Netflix varied over the years and how much Netflix is used in different parts of the world. These data visualizations have first been created using Tableau desktop and then shared online on Tableau public. In case you are interested in exploring some of my other visualizations created using Tableau, these are available at this link.
Contacts
If you want to keep updated with my latest articles and projects follow me on Medium and subscribe to my mailing list. These are some of my contacts details:
